
Chart Styling - Style Chart Parts in Code
In addition to our ThemeManager with light and dark themes, the ability to create a custom theme, you can also style chart parts in code.
We have an example in our SciChart.js Examples Suite which shows how to do this - the Styling a JavaScript Chart in Code example.
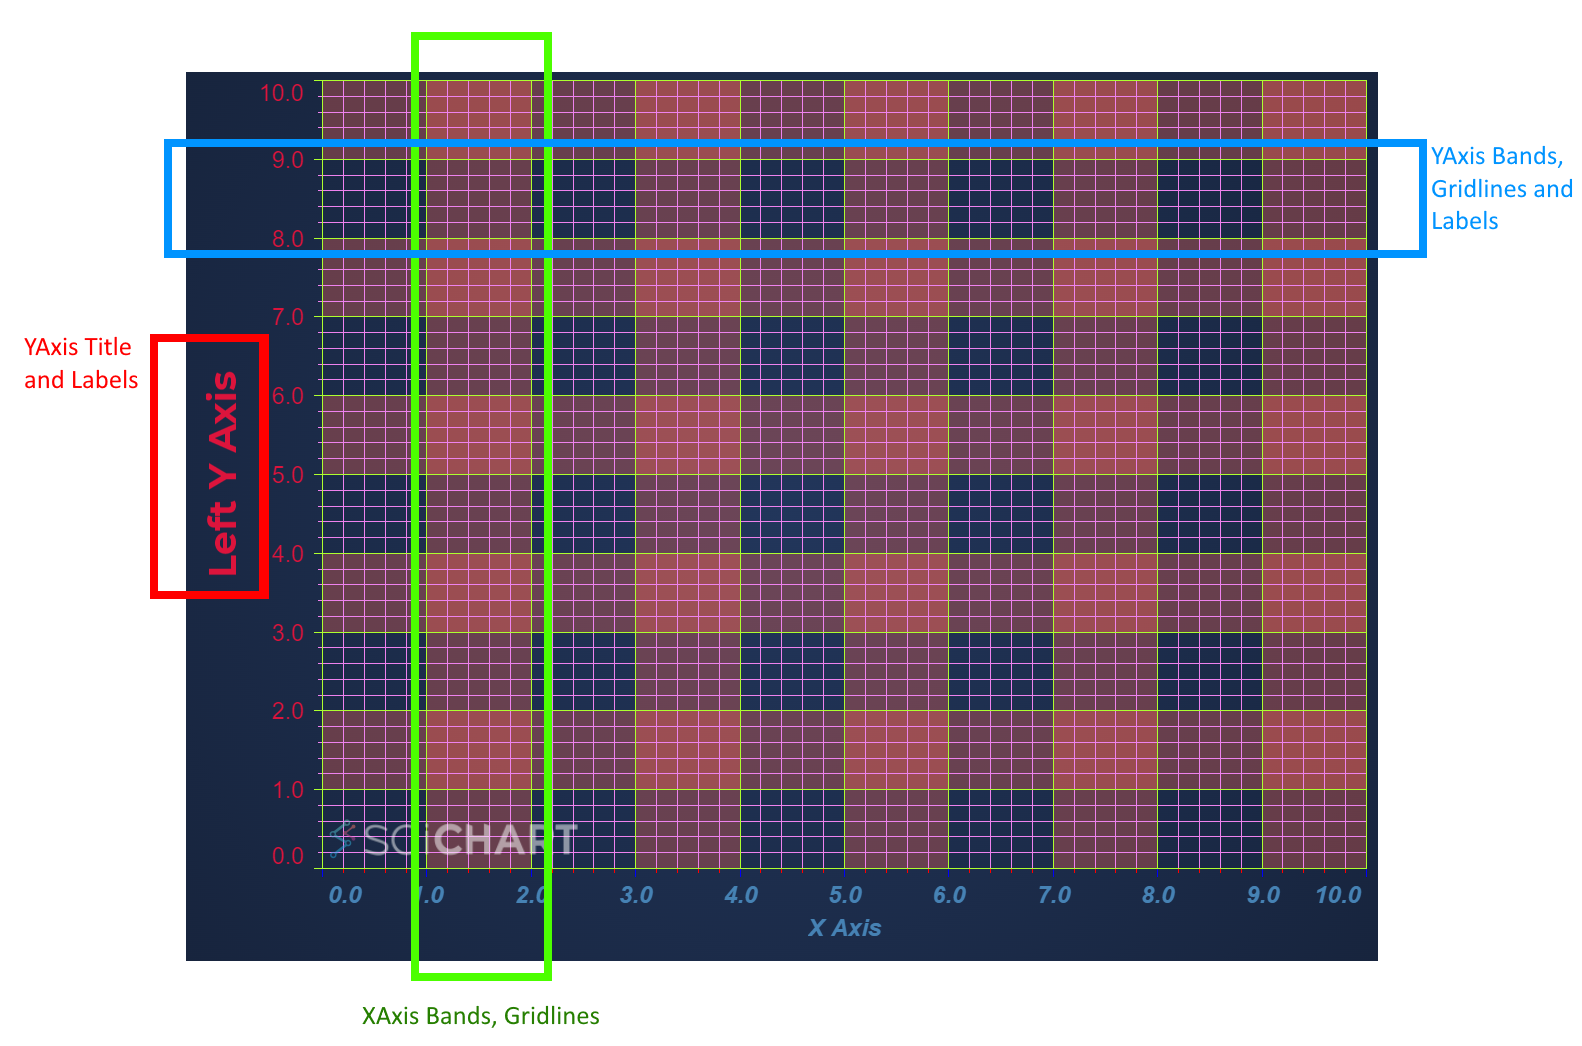
Above: the Styling Axis Gridlines, Labels example shows how to style chart-parts in code.
Take a look at the Styling a JavaScript Chart in Code example in our online demo which shows you how to style each individual chart part. The demo has link to source-code showing all the properties.
We also have a page that goes into detail on the various chart parts such as Axis Gridlines, Axis Ticks, Axis Labels that can be styled here.
See Also